Narrated Timed Lecture with Graphics
Ultimately, when designing, both concepts need to be used when the need to present data. The slide should be clear and clean with a minimum amount of data displayed while using audio to clarify. Graphics that make graphs and charts less confusing should be used while entertaining and engaging would keep with the proven theory that motivates learners and doesn’t lead to cognitive overload (Reiser & Dempsey, 2012, p. 117)”.
Learning is better from visuals “. . described by audio narration than by on-screen text (Reiser & Dempsey, 2012, p. 117)”. The idea that when you show visuals that are explained by audio narration is called the modality effect. This has been proven in a wide range of courses, classes, and subjects. With the different features of working memory “audio narration can be more effective (Reiser & Dempsey, 2012, p. 117)”. In addition, when “pictures are explained by words in audio format the information is divided . . . and in that way optimizes the capacity limits of working memory (Reiser & Dempsey, 2012, p. 117). They continue to suggest that the simpler and clearer the text there may be less of a need for the modality.
Kolovou, T. (2014, May 12). Presentation fundamentals [Lynda.com online course]. Retrieved from https://www.lynda.com/Business-Skills-tutorials/Welcome/151544/172760-4.html
Reiser, R. & Dempsey, J. (2012). Trends and issues in instructional design and technology. Boston, MA: Pearson.
Target Audience: High School and Adult learners

Narration in Keynote

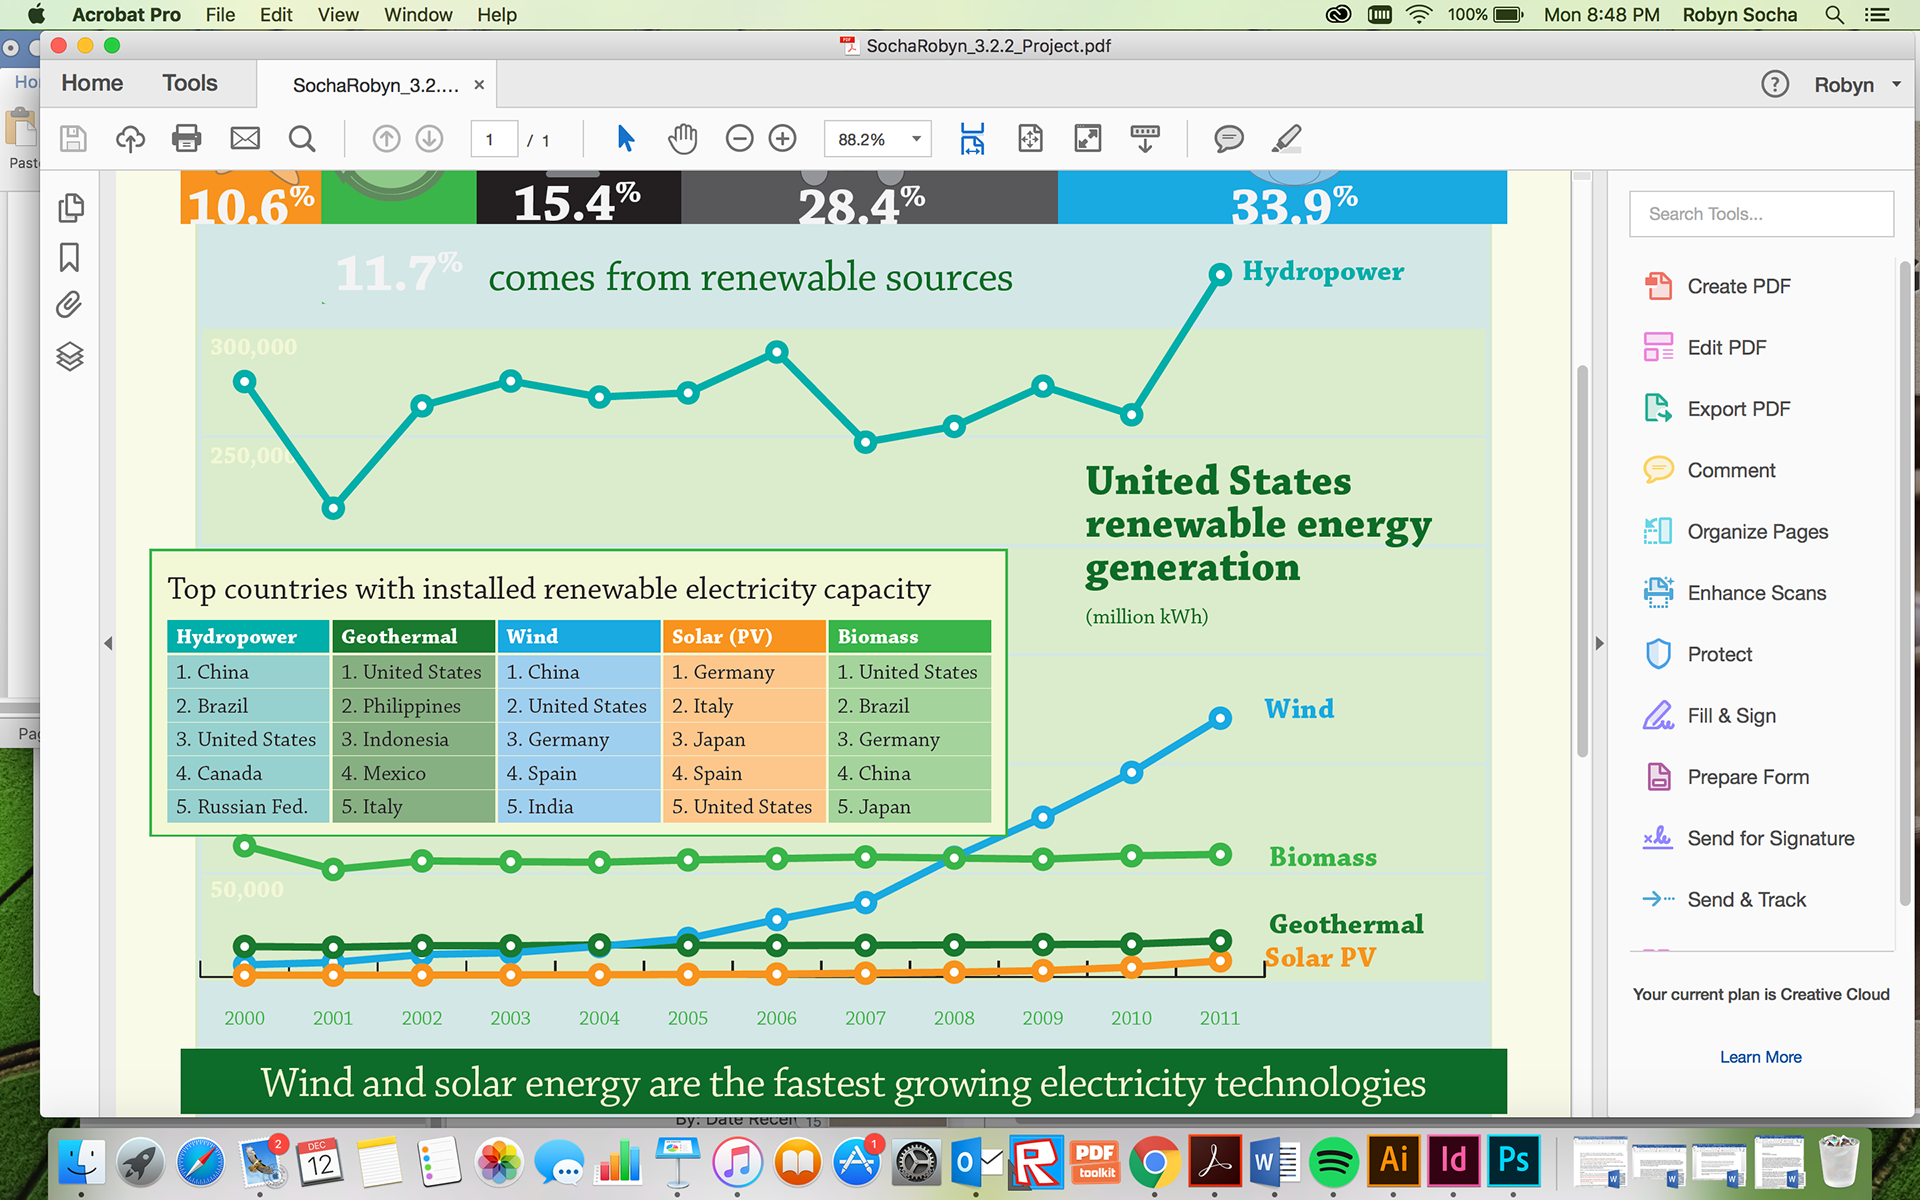
Work in Progress in Adobe Acrobat
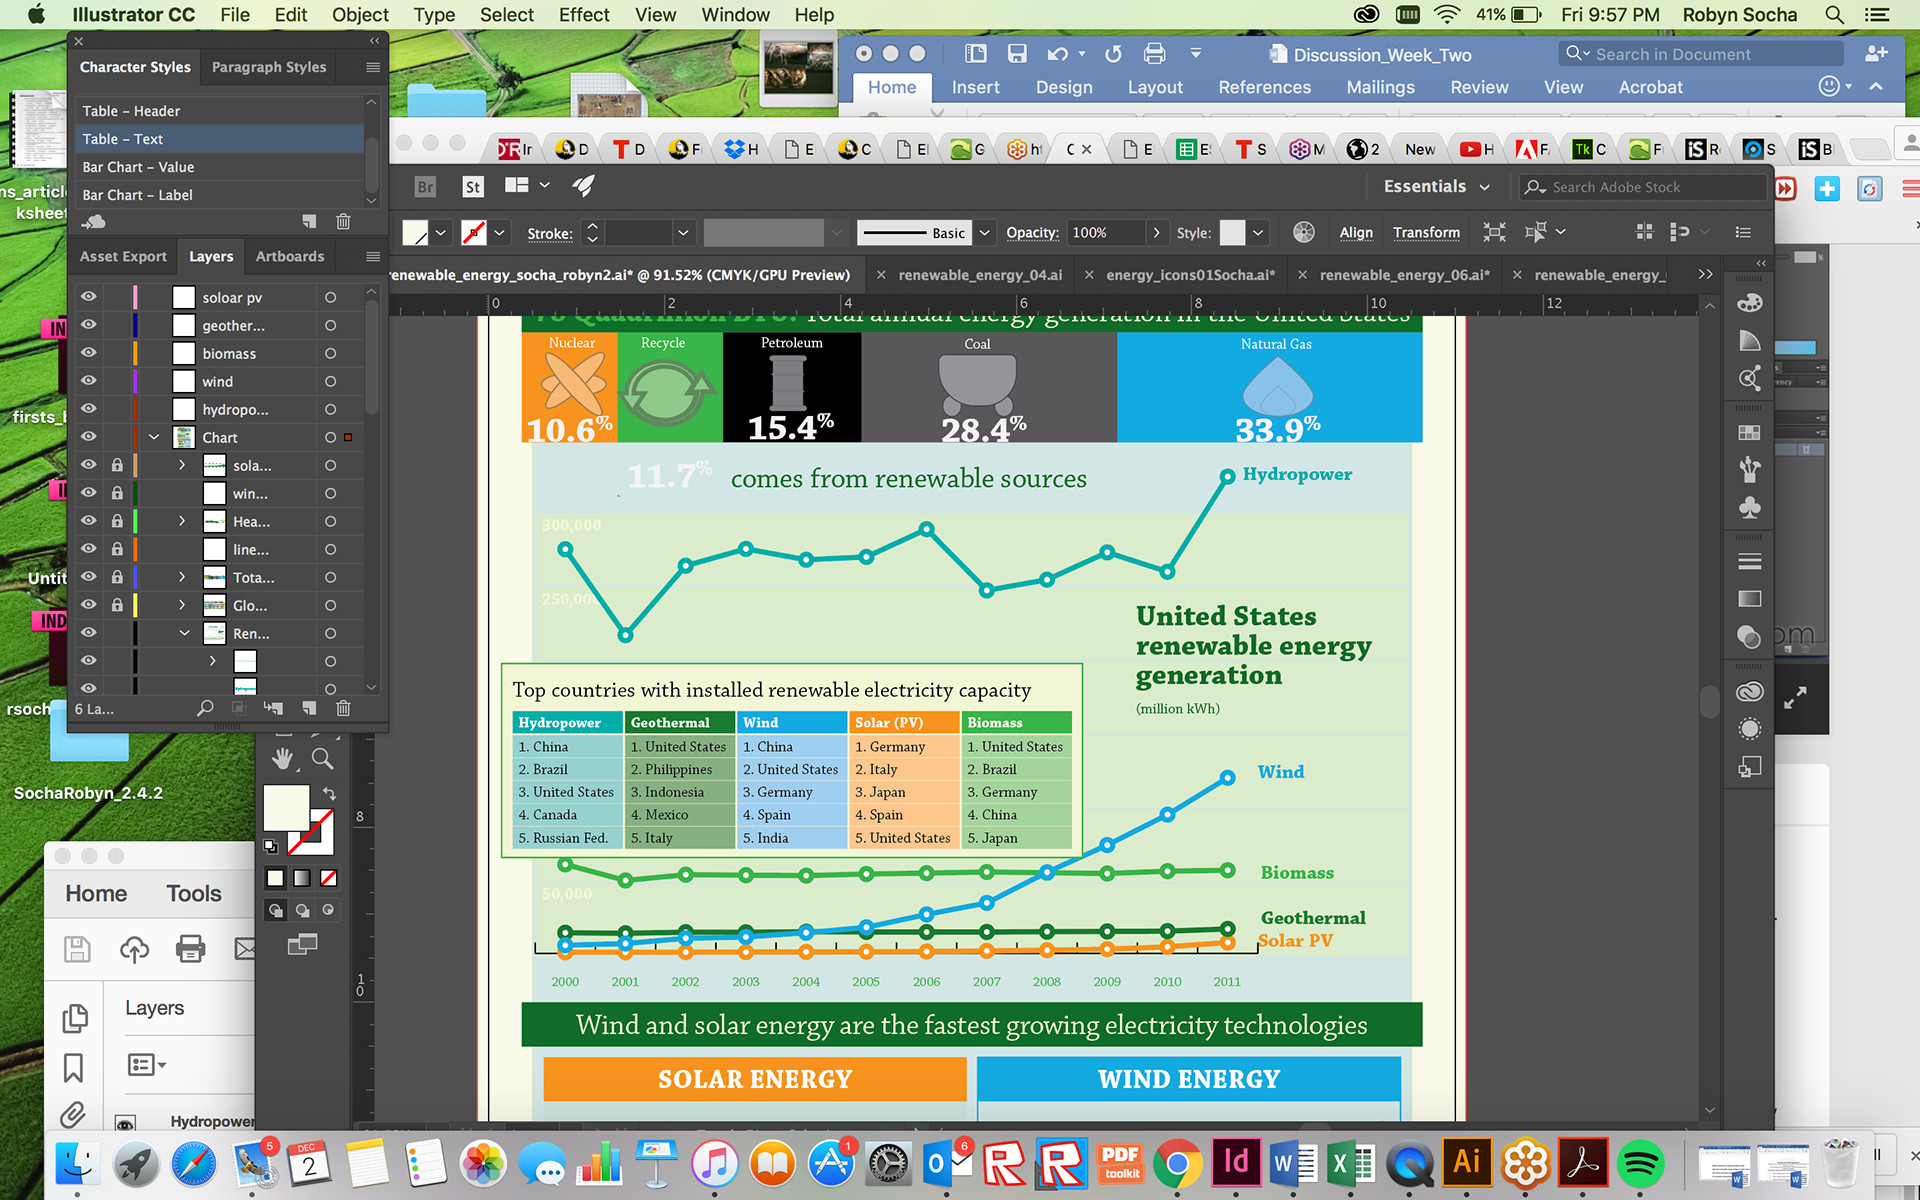
Work in Progress in Adobe Illustrator